The Future of Home Sales on 30A | My Crystal Ball
The Future of Home Sales on 30A
by Murray Balkcom, Luxury Realtor | Broker Associate
 People often ask me about the future of home sales on 30A. This morning, I pulled out my crystal ball to see, but I still cannot get it to predict the future. However, we can certainly look at where the market has been and where it is currently, which I will detail with clarity below.
Where is the current 30A real estate market for homes sold from a historical perspective?
 Rather than looking at monthly sales for comparison purposes, sometimes it is important to step back and look at a larger bank of data in order to gain a more powerful perspective so that you can make a better decision about purchasing or selling a home on 30A. For this article, I will be looking at home sales on 30A which were reported to Emerald Coast Association of Realtors (ECAR), for the first six months of each year. We will compare the year-to-date (YTD) thru June sales for each year going back to 2002 through 2015. Using more data for our comparison, gives a better basis for the numbers and movement in time.
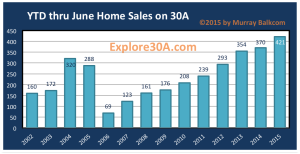
You will notice in the chart above, 421 home sales on 30A have been reported to ECAR in 2015, through the end of June, making 2015 the best year on record through the first half of each year. Already in 2015, we’ve set records for sales in April, May and June, so this information isn’t too surprising. As you can also see in the chart, 2014 was the second best YTD thru June for the quantity of homes sold on 30A. We’ve seen a steady rise since 2006, when only 69 homes were reported sold on 30A. The number of sales has jumped 510% since 2006, when comparing sales closing during the 1st half of each year. Even compared to the last year with 370 home sales on 30A thru June, the number of sales is up 13.8%. So, the quantity of home sales on 30A is strong and on the rise.
 What is happening with the sold dollar volume of homes on 30A?
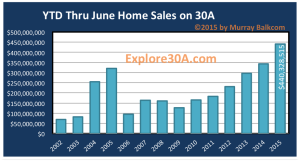
The chart, showing the sold dollar volume of homes on 30A, almost mirrors the quantity of homes sold, with 2015 being the strongest on record for YTD sales through June, with more than $440 million in sales. Again, the sales volume continues to increase steadily since 2009, when a mere $126 million was reported to ECAR. The 248% jump in dollar volume sold since 2009 is very substantial and says much about where our market stands today in comparison to previous years, some of which we often refer to as “the peak market.”
Click Here: Register for Murray’s Exclusive Monthly Newsletter for 30A Real Estate
Search for Your Dream Home
[idx-quick-search format=”horizontal”]


